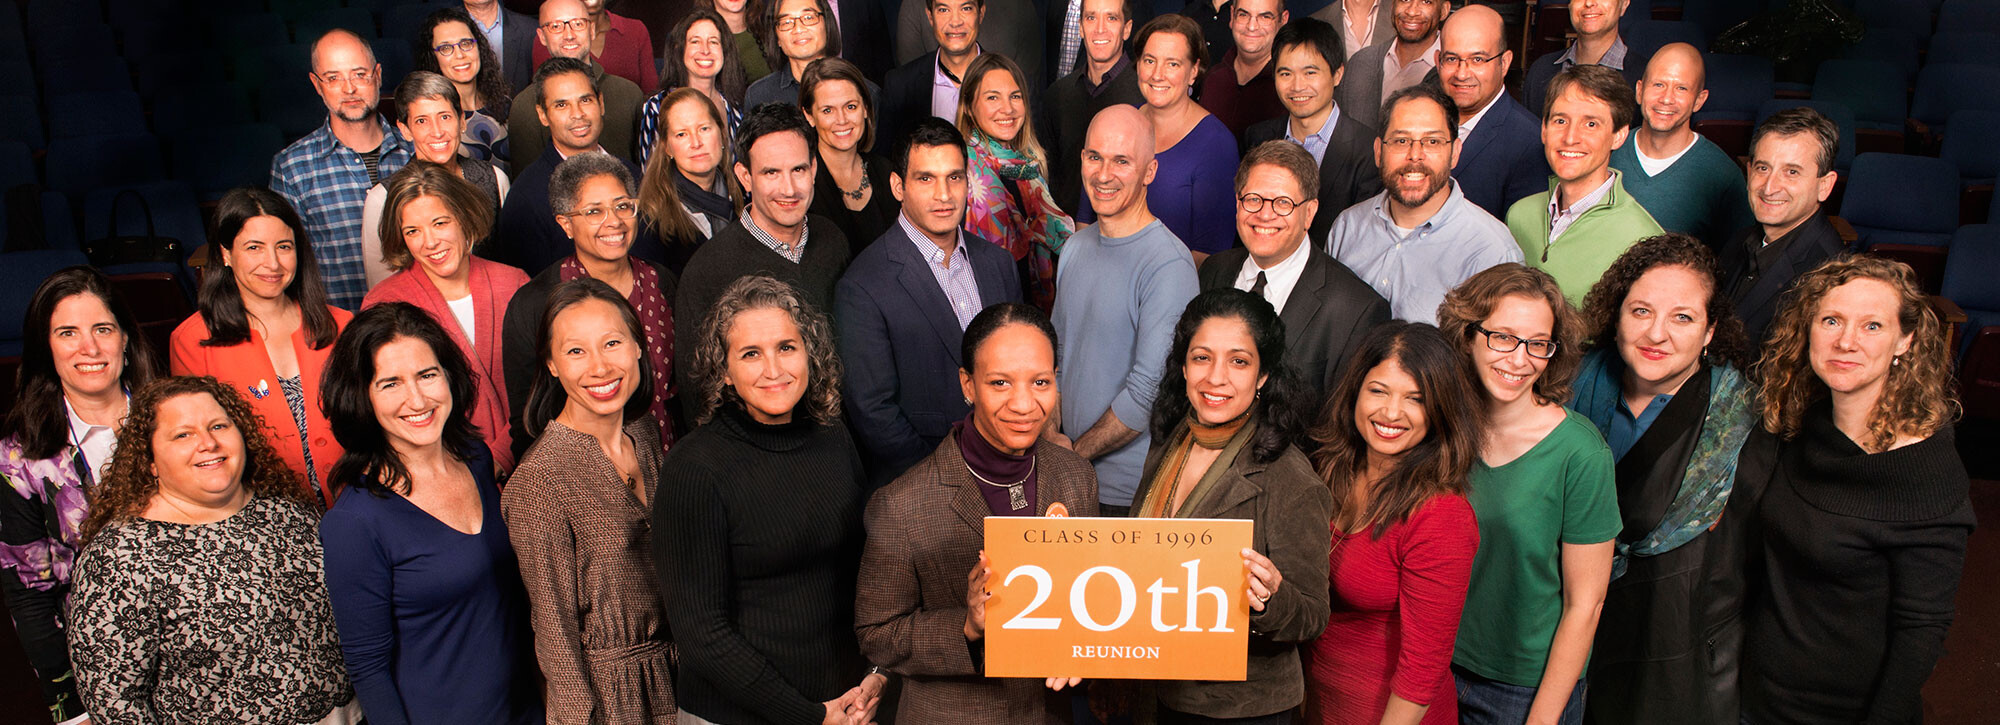
Alumni Demographics
We thought you would enjoy these demographic statistics from the Yale University Office of Alumni Records. Please note, a significant number of alumni do not provide responses to some or all of the Office of Alumni Records questions, and therefore the numbers do not always "add up." Moreover, information is not always updated by alumni (now that we have a fillable form, it should be easy to update your information!) With those disclaimers, please enjoy these stats which do provide a general, if fuzzy, snapshot of our graduates!
Facts and Statistics
Number of living alumni: 13,487
Number of alumni living in the USA: 11,570
Number of alumni living outside the USA: 1,161
Number of alumni living in unreported locations: 756
Alumni live in: 50 states
Alumni live in: 84 countries
Gender:
Male: 9,009
Female: 4,337
Unidentified: 142
Degree type:
J.D.: 9,714
LL.B.: 1,560
LL.M.: 1,571
J.S.D.: 326
M.S.L.: 188
Twenty states with the most alumni:
1. New York: 2,298
2. California: 1,777
3. Washington, DC: 885
4. Connecticut: 690
5. Maryland: 684
6. Virginia: 499
7. Massachusetts: 496
8. Florida: 357
9. Pennsylvania: 344
10. Illinois: 338
11. New Jersey: 325
12. Texas: 317
13. Washington: 232
14. Colorado: 186
15. Georgia: 164
16. North Carolina: 161
17. Ohio: 145
18. Oregon: 135
19. Minnesota: 112
20. Michigan: 109
Twenty metro areas with the most alumni:
Twenty countries outside the United States with the most alumni:
Top 20 Industries (self-reported using University’s occupation codes):
1. Private Practice: 3,280
2. Education (All): 1,245
3. Finance (Banking/Investment/Venture Capital/Other): 467
4. Law, Public Interest: 438
5. Gov’t Service, Non-Elective, Federal: 406
6. Law, Other (Profit): 292
7. Law, Other (Non-Profit): 230
8. Court System: 137
9. Journalism and Writing: 128
10. Gov’t Service, Non-Elective, State: 117
11. Entertainment/Cinema/Film/Television/Theatre: 108
12. Real Estate: 87
13. Computers (All): 77
14. Consulting, Management: 73
15. Health Care/Maintenance (All): 68
16. Gov’t Service, Non-Elective, Local: 63
17. Gov’t, Other: 43
18. Business, Non-Manufacturing, Other: 39
19. Foundation/Association: 38
20. Manufacturing, Other: 33
(Updated September 2019)
